
Report Dashboard Widget Attributes
Here are the key Report Dashboard Widget Attributes:
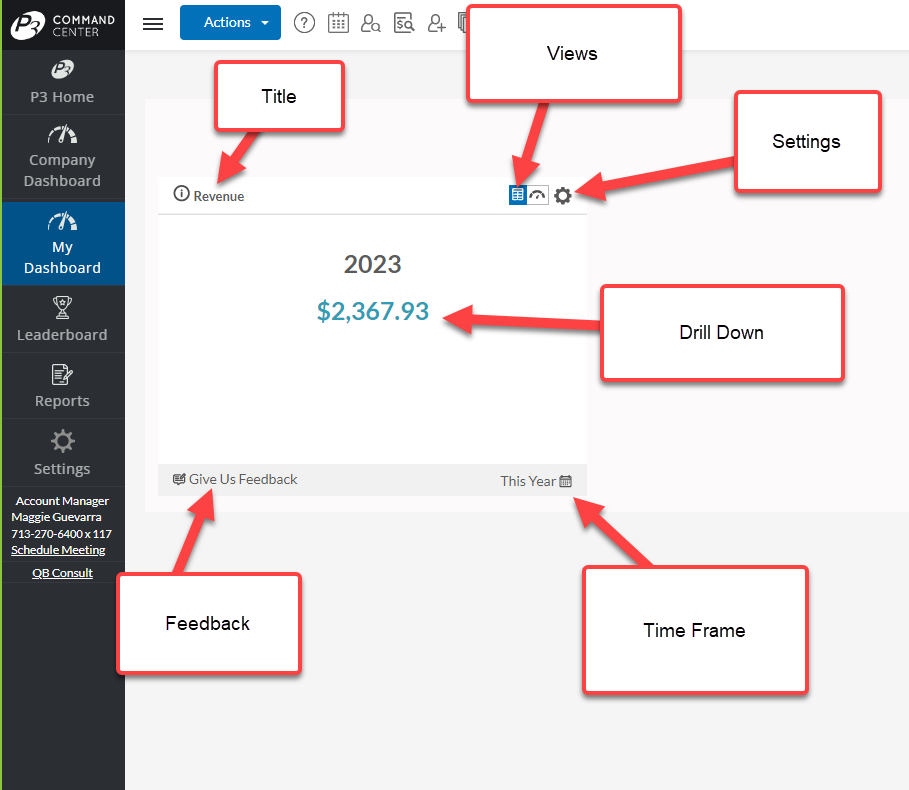
- Title – there is a default title, but each can be customized
- Settings – this is where you can change the default title name
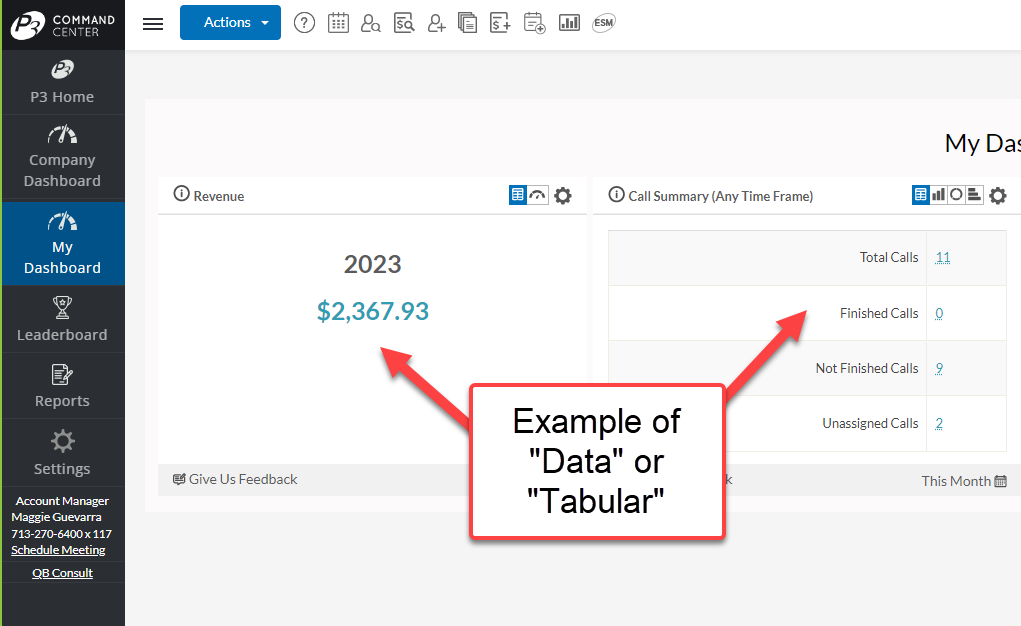
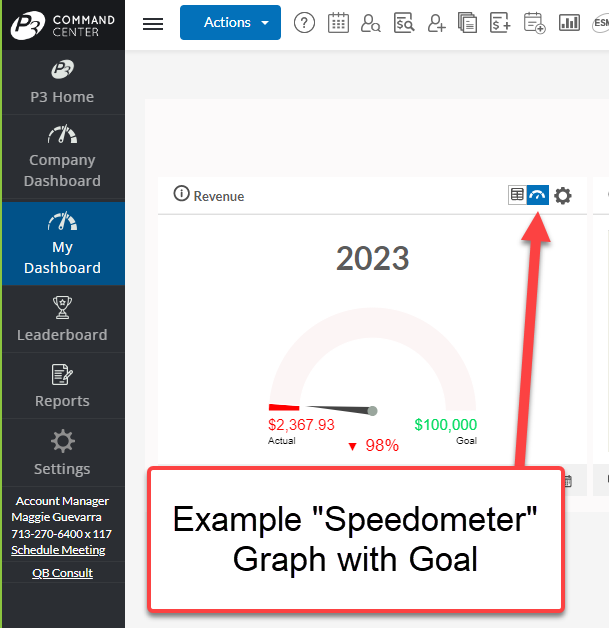
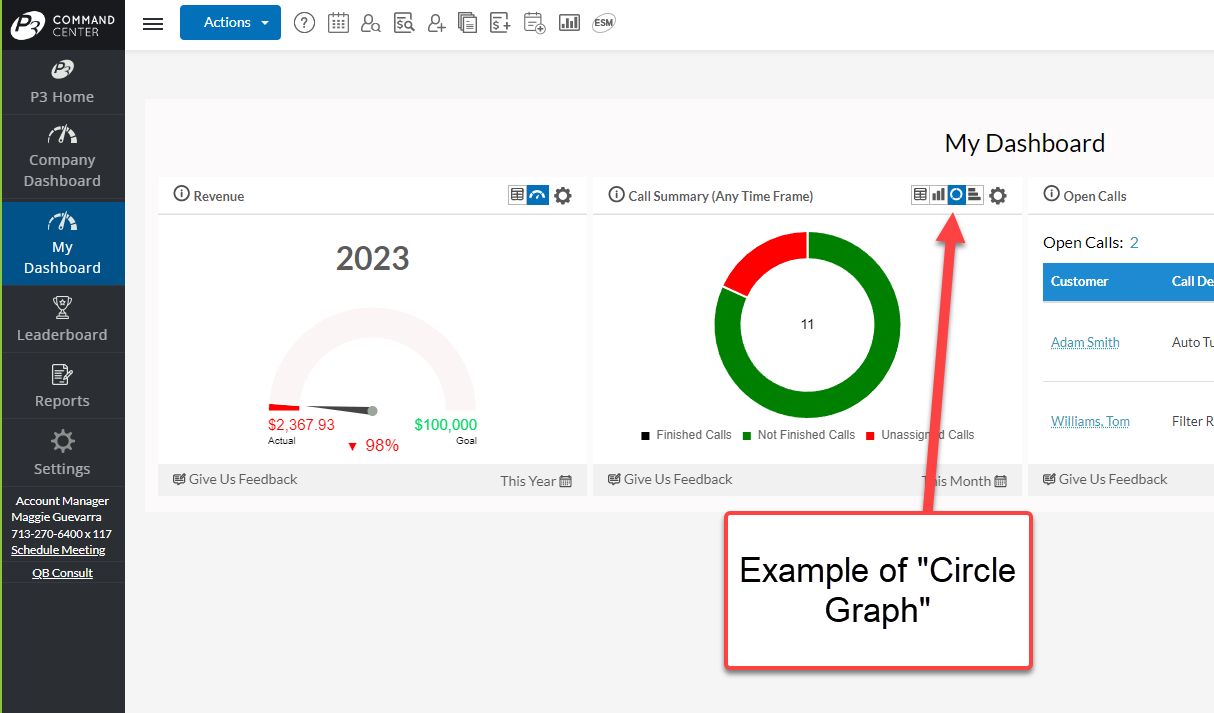
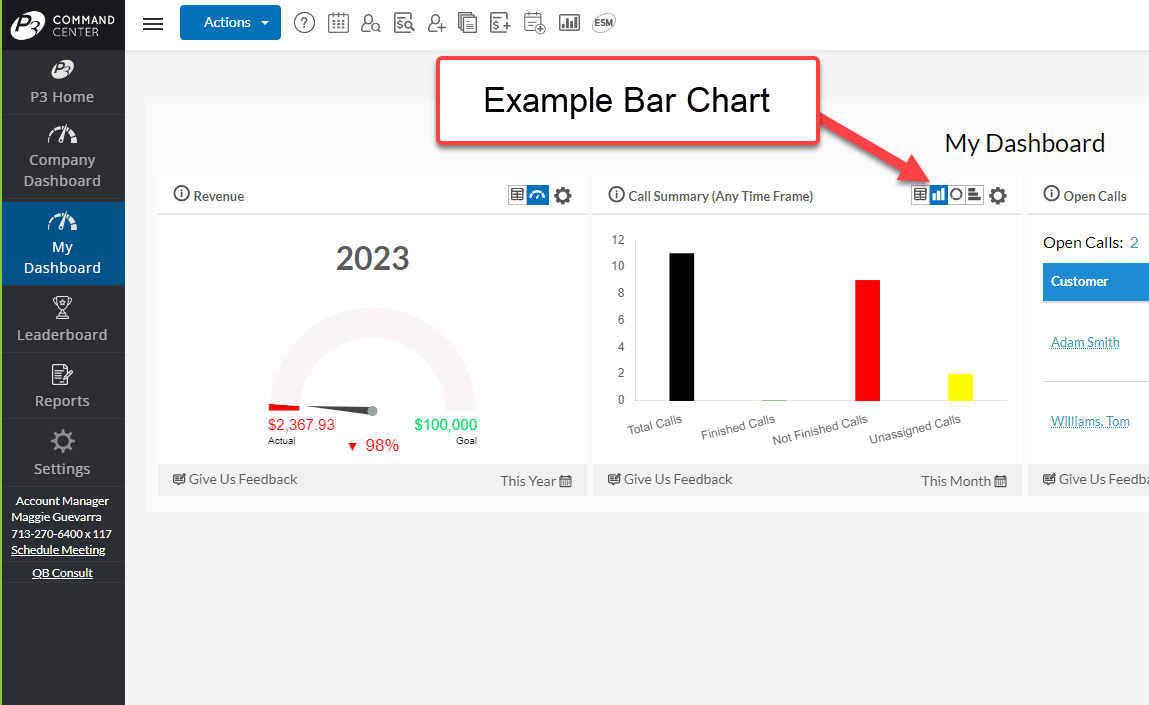
- Views – some widgets have more than one view available – for example, tabular or graph view
- Time Frame – some widgets are set for a particular time and other the time frame can be changed
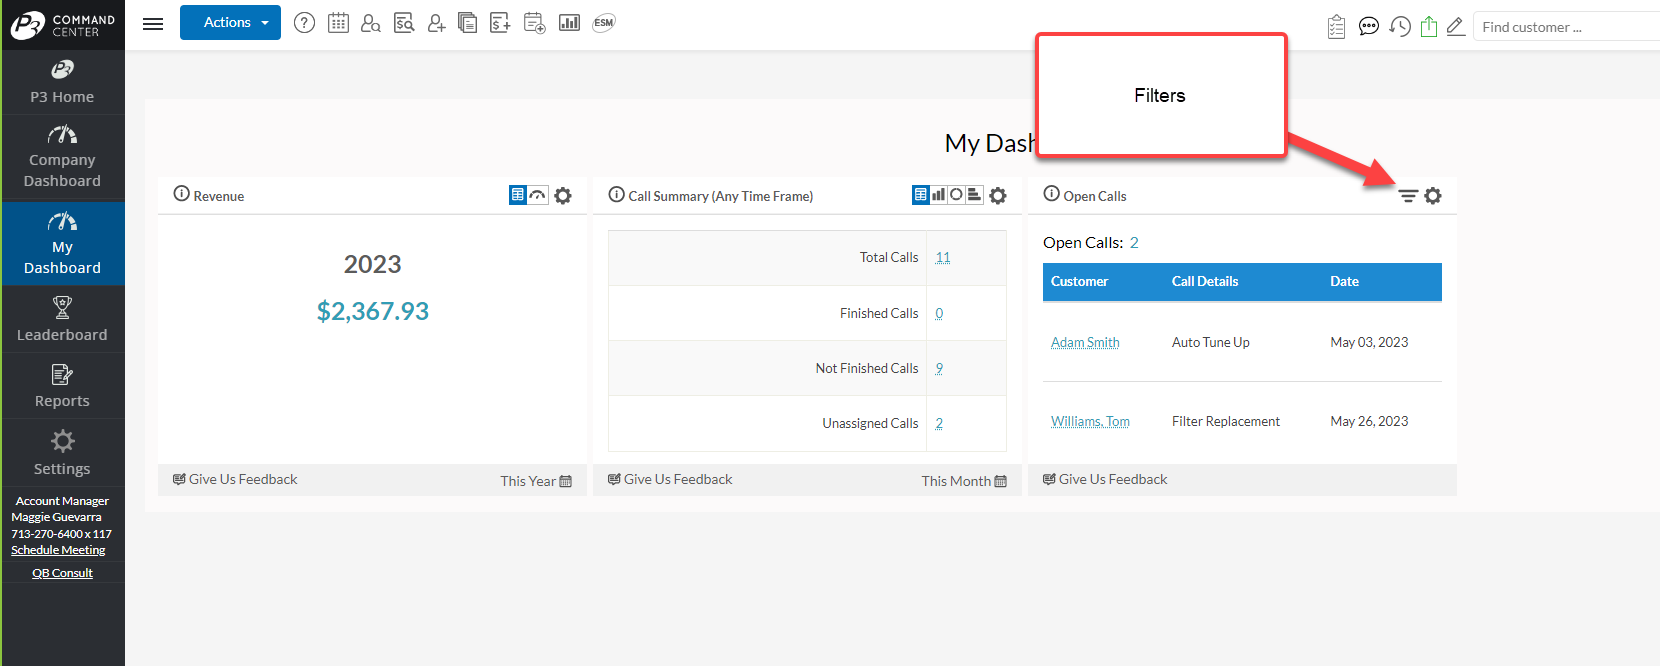
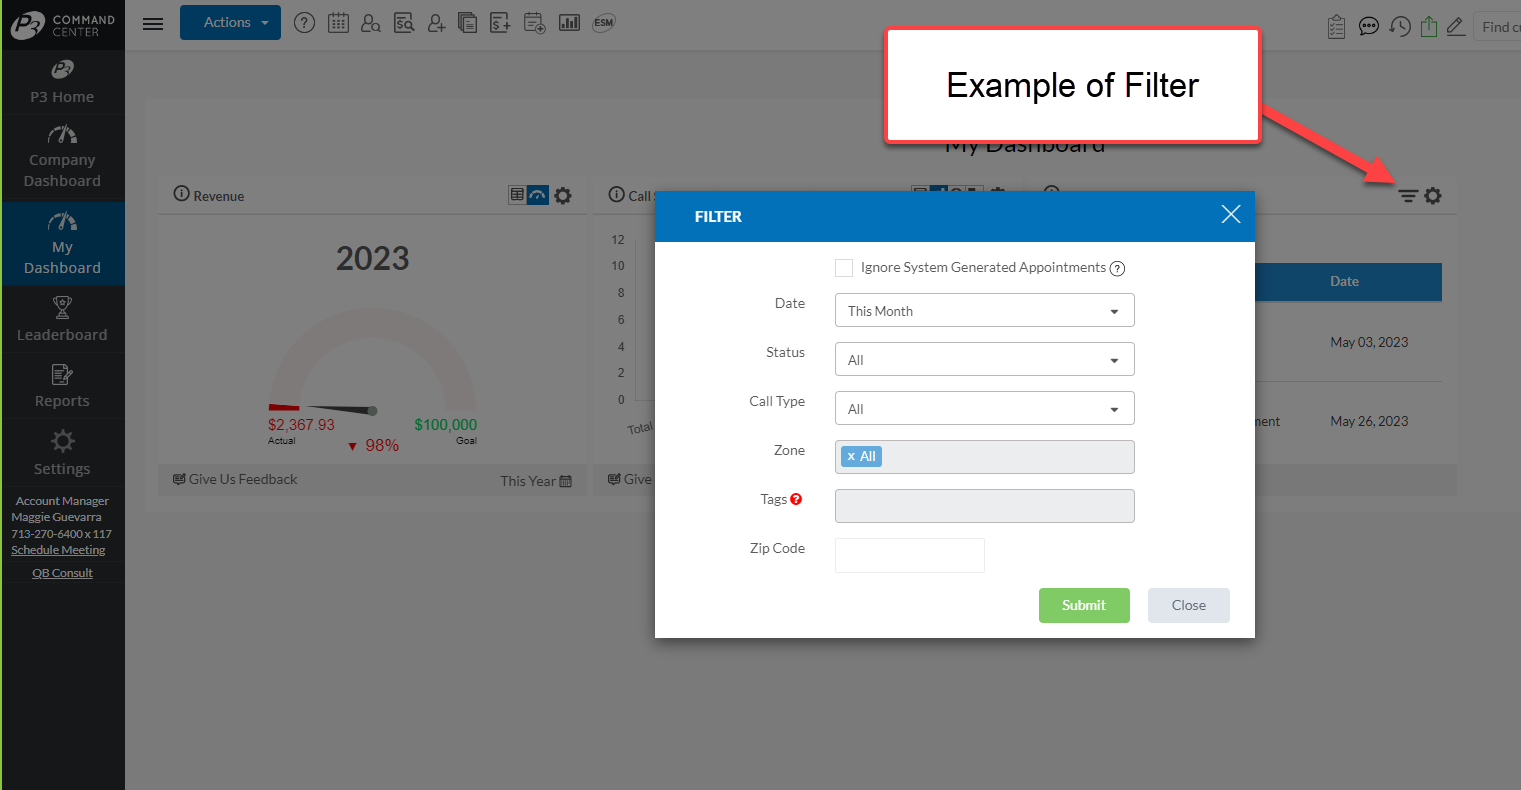
- Filters – some widgets allow for the selection of particular data within the report
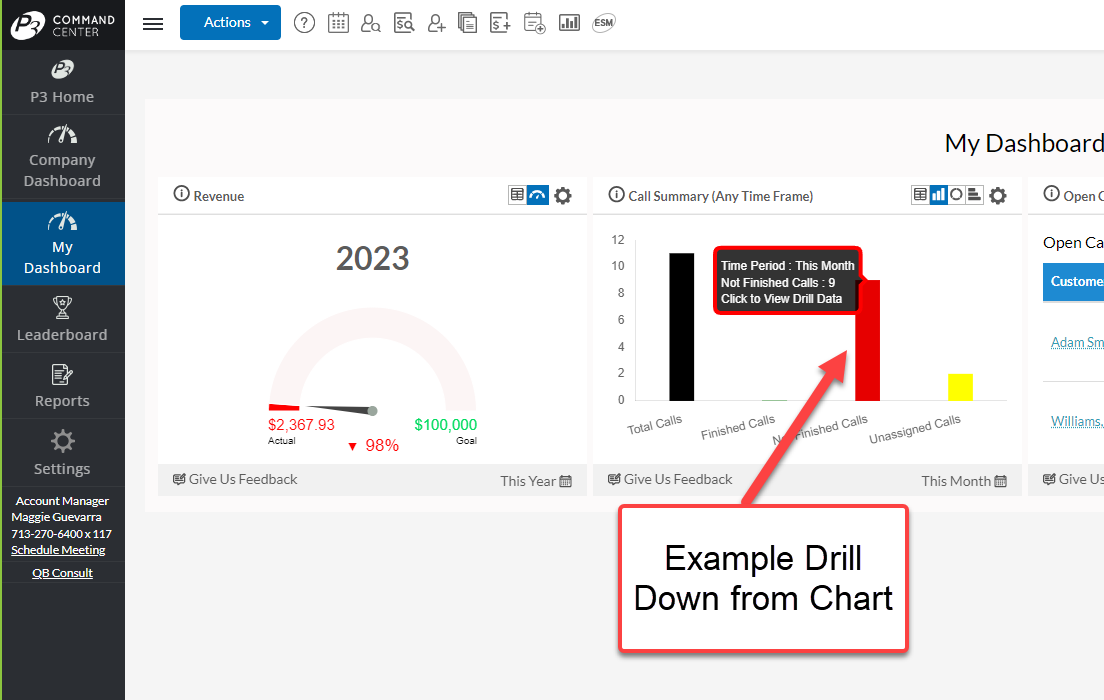
- Drill Down – for each piece of data displayed, one can click to drill down to see how P3 calculated the value and to see more details
- Feedback – all widgets have the ability to send feedback on the widget to the Help Desk
Views
- Data/Tabular
- Speedometer
- Bar Chart (Vertical)
- Bar Chart (Horizontal)
- Circle Graph
Time Frames
- Day
- Week
- Month
- Quarter
- Year
- All
Filters
- Will vary based on the Report
- Similar to the “Search Criteria” on Reports
Report Widget Attributes
About P3 HVAC Software
We encourage you to review our site and learn about how we help HVAC Companies operate more efficiently. Please use this link to schedule a free demo of P3 HVAC Software. Lastly, be sure to check in weekly as we will post a new Tool Tip each Tuesday. Lastly, current users of P3 HVAC Software, please be sure to join our Private Facebook Group for great discussions with other HVAC Companies on how they are using the software for their HVAC business.
