
Report Dashboard represents a major update to the P3 software. With the functionality each administrator (dispatcher, service manager, owner) with access to the P3 Command Center, can create a custom Dashboard of reports.
Definitions
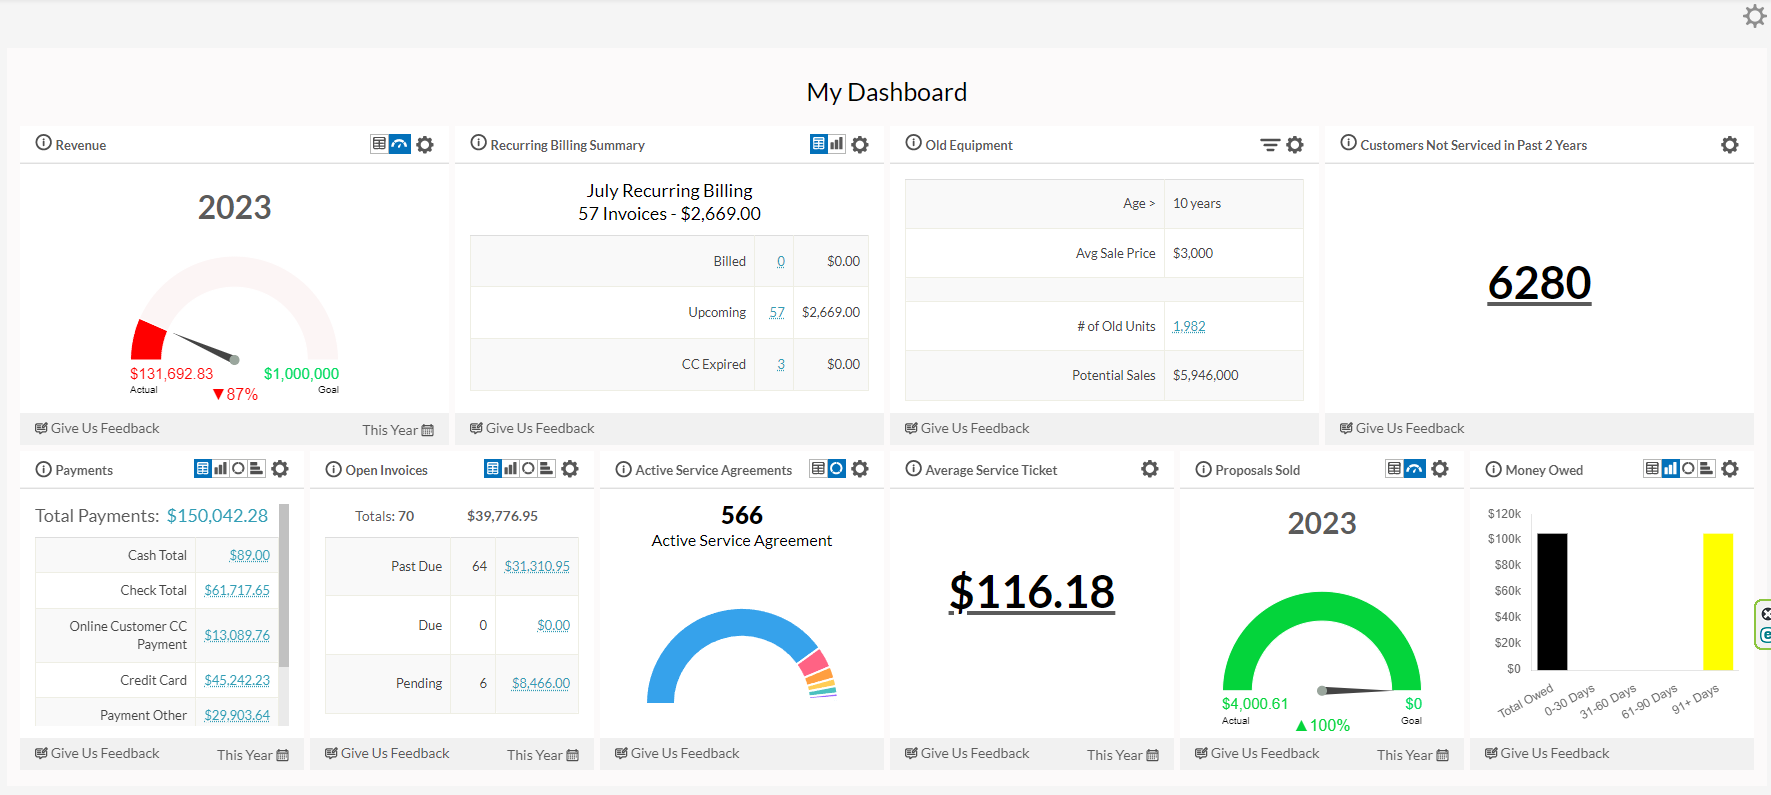
Report Dashboard – the page that displays Report Widgets. It is labeled “My Dashboard” and it will display on the left hand menu.
Report Widgets – the individual reports that are displayed on the Report Dashboard
Give Permission to the Report Dashboard
When activated a “My Dashboard” icon will appear on the left hand side menu. To activate the Report Dashboard, two things must happen:
- Permission to access Dashboard Functionality must be granted
- Permission to access individual Report Widgets must be granted
- Both are completed via the normal Permission control on the Admin User page
Please note that when we go live with the functionality only Super Admin users will have been given access to the Report Dashboard and all Report Widgets. Individual Admins will have no access to the Dashboard until granted by one of the System Admins for your company.
Report Dashboard Attributes
The Report Dashboard contains the following:
- The Dashboard can have up to 3 Rows of Report Widgets
- The first row will contain 4 “Primary” Report Widgets
- The second and third rows will contain 6 “Secondary” Report Widgets
- There are 34 Report Widgets available, but only 16 can be displayed on a Dashboard
- The only difference between “Primary” and “Secondary” is the display size of the report – the content and data are the same. If the Report Widget is important and it needs to stand out, place it in the top row.
- You can display anywhere from 1 to 16 Report Widgets on your Dashboard – you do not have to fill it up
How to Customize
Once, activated each person at the company can customize their individual Dashboard.
- Click the “My Dashboard” icon
- In the upper right hand corner, click the Settings/Gear icon
- Drag and Drop the desired Report Widgets into the “Selected Reports” table
- Please note the first 4 Report Widgets listed in the “Selected Reports” table will be the ones listed in the first row of the Dashboard, going left to right; i.e. the Report Widget at the top of the list, will be the first report viewed on the left hand side of the row. Report number 5 in the list, will be first Report Widget displayed in Row 2, etc.
- To remove a Report Widget, click the “x”
Report Widget Attributes
Here are the attributes of each Report Widget:
- Title – there is a default title, but each can be customized
- Settings – this is where you can change the default title name
- Views – some widgets have more than one view available – for example, tabular or graph view
- Time Frame – some widgets are set for a particular time and other the time frame can be changed
- Filters – some widgets allow for the selection of particular data within the report
- Drill Down – for each piece of data displayed, one can click to drill down to see how P3 calculated the value and to see more details
- Feedback – all widgets have the ability to send feedback on the widget to the Help Desk
Customize the Report Widget
The Dashboard will lock in and save any adjustments made to a Report Widget. For example,
- If you change the title, the next time your Report Dashboard loads, the new title will display
- If you change the default view to let’s say a “Circle Graph”, then next time the Report Dashboard loads, that view will automatically display
- If you change the Time Frame or Filters, the next time the Report Dashboard loads, it will load the Widget based on what was selected
- Please note there is no Save button – merely clicking on the view or filters will save that designation
Special Report Widgets – Multiple Display and Goals
Some Report Widgets can be added to the Report Dashboard multiple times. For example, maybe an owner wants to quickly see both Monthly Income and Annual Income. As a result, the Revenue Widget can be displayed twice – once for the monthly Time Frame and once for the Annual Time Frame. Any Report Widget that has a Time Frame or Filters, can be added to the Report Dashboard more than once. In these instances, we strongly advise changing the Title to reflect either the Time Frame or Filters.
In addition, some Report Widgets have the ability to set a Goal. For example, with the Revenue Widget a Goal can be set to track progress.
Example
About P3 HVAC Software
We encourage you to review our site and learn about how we help HVAC Companies operate more efficiently. Please use this link to schedule a free demo of P3 HVAC Software. Lastly, be sure to check in weekly as we will post a new Tool Tip each Tuesday. Lastly, current users of P3 HVAC Software, please be sure to join our Private Facebook Group for great discussions with other HVAC Companies on how they are using the software for their HVAC business.
